“Simple things bring infinite pleasure. Yet, it takes us a while to realize that. But once simple is in, complex it out – forever.” ― Joan F. Marques
Now that I have your attention, let me clear up the word “flames.” The flames that I’m referring to have nothing to do with fire. All I am talking about is performance tools in Node.js. When it comes to performance, everyone thinks of fighting fires, as many think performance optimization is a nightmare. Most of us think only that some individuals are masters in profiling.
Anyone can become master in profiling when given simple tools. At eBay, we strive to make things simple and easy for our developers to use. During the course of Node.js development and production issues, we soon realized that profiling in Node.js is not an easy thing to do.
Before jumping to the CPU profiling tool that simplified our lives, let me walk you through our journey that ended up in seeing flame charts from a completely different angle.
Flame graphs using kernel tools
With Brendan Gregg’s flame graph generation, it was much easier to visualize CPU bottlenecks. However, we need to run a small number of tools and scripts to generate these graphs.
Yunong Xiao has posted an excellent blog on how to generate flame graphs using the perf command based on Gregg’s tools. Kernel tools like DTrace (BSD and Solaris) and perf (Linux) are very useful in generating stack traces from the core level and transform the stack calls to flame graphs. This approach gives us complete picture from Node internals, from the V8 engine all the way to JS code.
However, running tools like this need some good understanding on tool itself and sometimes you need different OS itself. In most cases your production box and profiling box setup differ completely. This way makes it hard to investigate the issue going in production as one has to attempt to reproduce this issue in completely different environment.
After managing to run the tools, you will end up with flame charts like this.
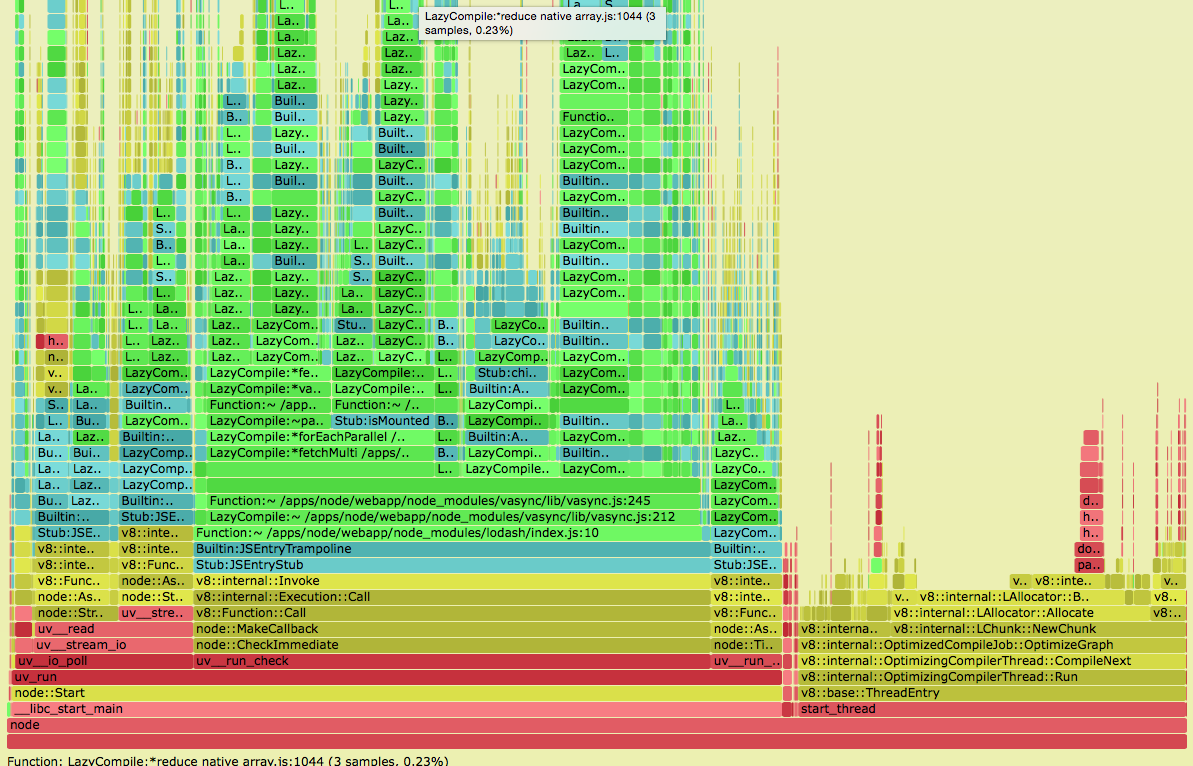 Image source from Yunong Xiao’s blog
Here are some pros and cons for this approach.
Pros:
- Easy to find CPU bottleneck
- Graphical view
- Complete profile graph for native and JS frames.
Cons:
- Complexity in generating graphs.
- Limited DTrace support by different platforms, harder to profile in DEV boxes
Chrome profiling tool
The Chrome browser is just amazing. It is famous not only for its speed but also for its V8 engine, which is core to Node.js. In addition to these features, one tool that web developers love about Chrome is Developer Tools.
There is one tool inside Developer Tools that is used to profile browser-side JS. The v8-profiler enables us to use server-side profile data in the Chrome Profile tool.
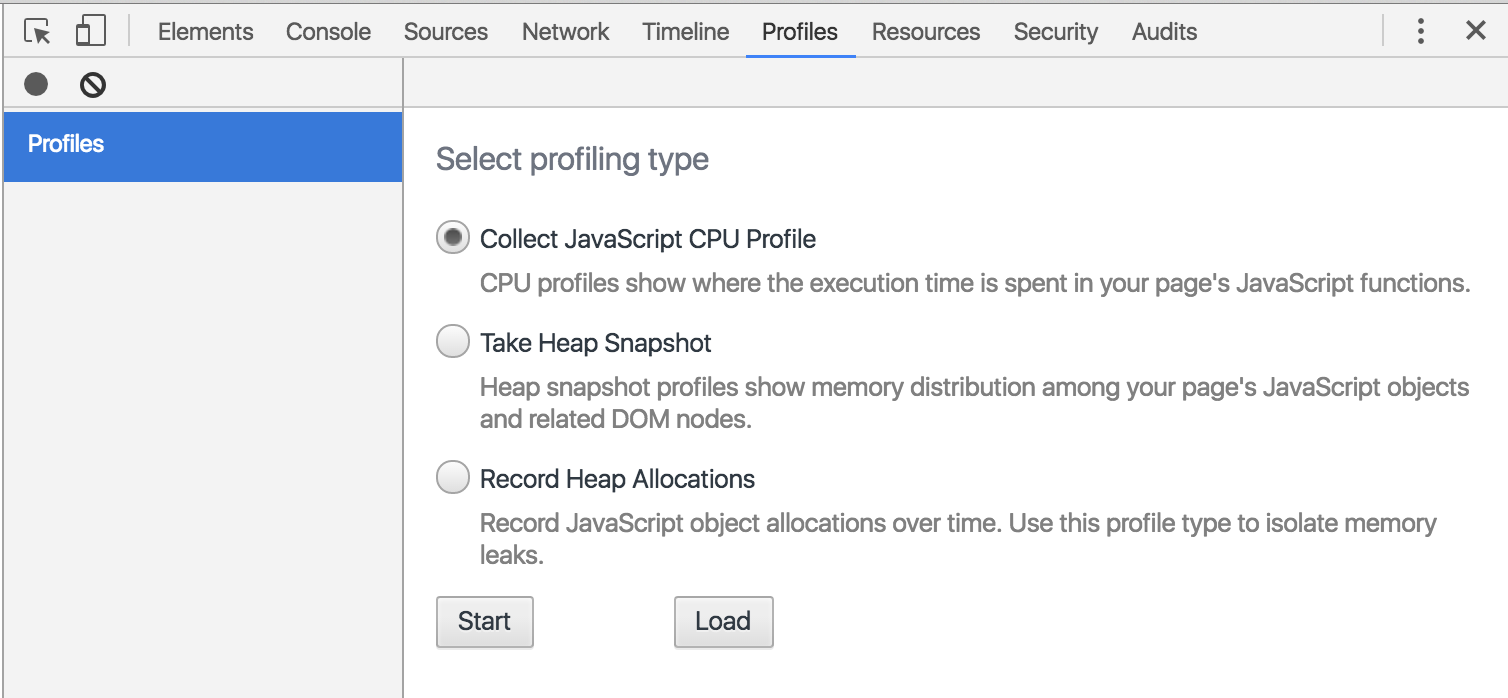
Let us see how we can use this for profiling our Node.js application. Before using Profiles in Chrome, we have to generate some profiling data from our running Node.js application. We will use v8-profiler for creating CPU profile data.
In the following code, I have created a route /cpuprofile for generating CPU profile data for a given number of seconds and then streaming the dump to a browser to open in Chrome.
This sample code creates a CPU dump using v8-profiler.
//file index.js
var express = require('express');
var util = require('util');
var profiler = require('v8-profiler');
var app = express();
app.get('/', function(req, res){
 res.send(“Hello World!!”);
});

app.get('/cpuprofile', function(req, res){
    var duration = req.query.duration || 2;
    res.header('Content-type', 'application/octet-stream');
    res.header('Content-Disposition', 'attachment; filename=cpu-profile' + Date.now() + '.cpuprofile');
    //Start Profiling
    profiler.startProfiling('CPU Profile', true);
    setTimeout(function(){
       //Stop Profiling after duration
       var profile = profiler.stopProfiling();
       //Pipe profile dump to browser
       profile.export().pipe(res).on('finish', function() {
            profile.delete();
       });
    }, duration * 1000); //Convert to millisec
});
app.listen(8080);
To generate CPU profile data, use these steps:
- Start your app.
node index.jsIt’s a good idea to run
abto put some load on the page. - Access the CPU profile dump using http://localhost:8080/cpuprofile?duration=2. A
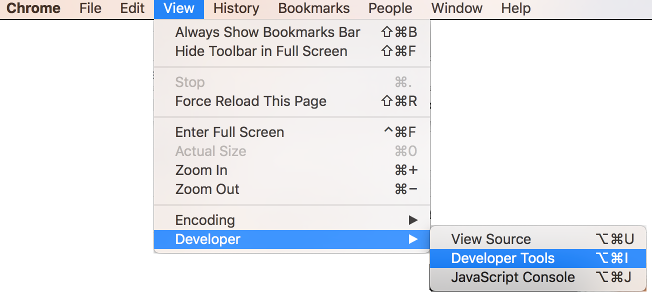
cpu-profile.cpuprofilewill be downloaded from the server. - Load the downloaded file
cpu-profile.cpuprofilein Chrome using Developer Tools > Profiles > Load. Upon loading, you should see in your Profiles tab something like the following.
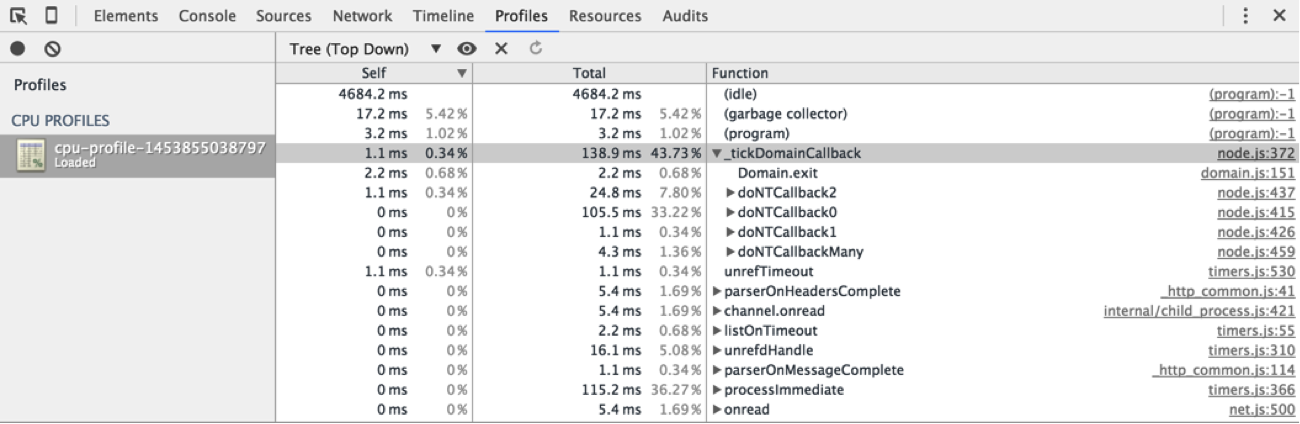
Now that you have opened profile data, you can drill down the tree and analyze which piece of code is taking more CPU time. With this tool, anyone can generate profile data anytime with just one click, but just imagine how hard it is to drill down with this tree structure when you have big application.
In comparison to Flame Graphs using Kernel Tools, here are some pros and cons.
Pros
- Easy generation of a profile dump
- Platform independent
- Profiling available during live traffic
Cons
- Chrome provides a graphical view for profile data, but the data is not aggregated and navigation is limited.
Flame graphs @ eBay
Now that we have seen two different approaches for generating CPU profile data, let us see how we can bring in a nice graphical view like flame graphs to V8-profiler data.
At eBay, we have taken a different approach to make it very simple and easy to use tool for our Node.js developers. We used V8-profiler data, applied the aggregation algorithm, and rendered the data as flame charts using the d3-flame-graphs module.
If you look at the .cpuprofile file closely (created above), it is basically a JSON file. We came across a generic d3-flame-graphs library that can draw flame graphs in a browser using input JSON data. Thanks to “cimi” for his d3-flame-graphs module.
After we made some modifications to the chrome2calltree aggregation algorithm and aggregated profile data (removed core-level CPU profile data), we could convert .cpuprofile data file to JSON that can be read by d3-flame-graphs, and the final outcome is simply amazing.
Three-step process
- Generate
.cpuprofileon demand usingv8-profileras shown in Chrome Profiling Tool. - Convert
.cpuprofileinto aggregated JSON format (source code). - Load the JSON using
d3-flame-graphsto render the flame graph on browser.
Output
This time access CPU flame graph on browser using the same URL (http://localhost:8080/cpuprofile?duration=2) from Chrome Profiling Tool.
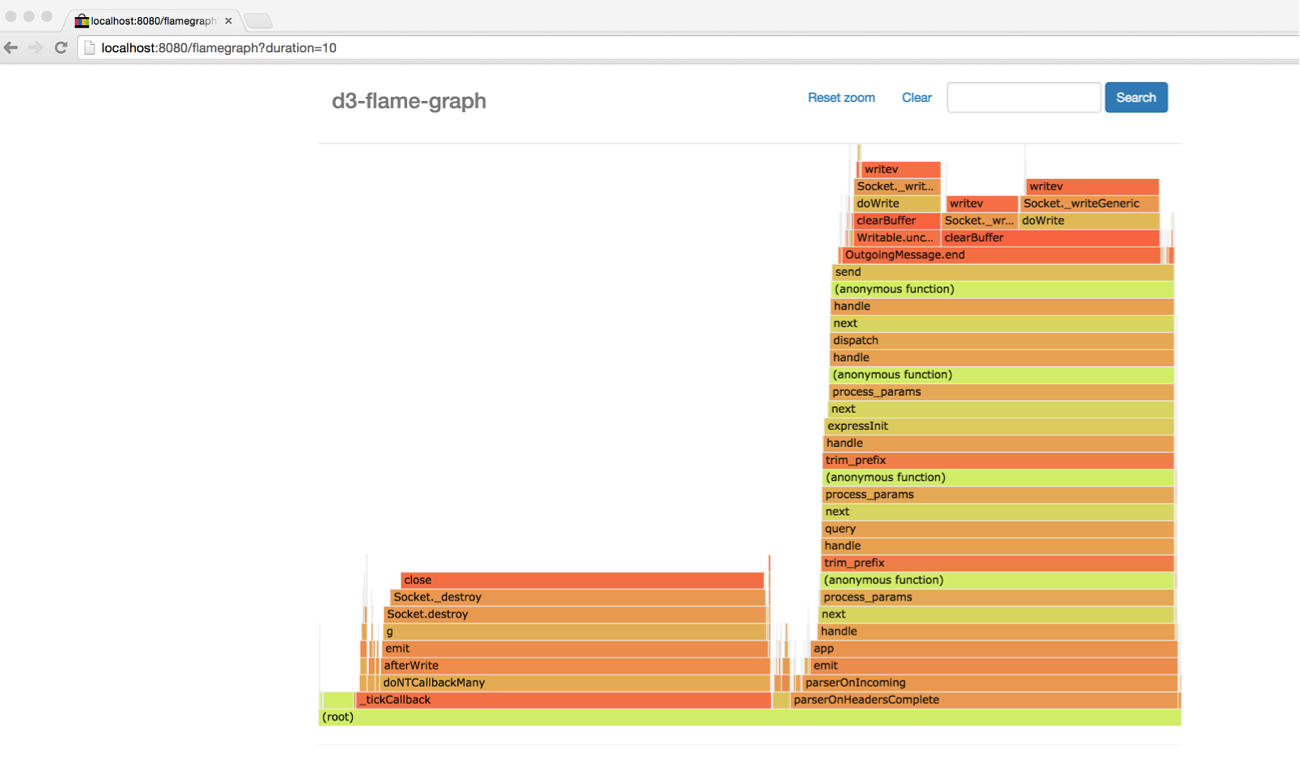
The above flame chart shows only JS frames, which is what most Node application developers are interested in.
Third-party packages used
expressjs(npm)v8-profiler(npm)d3-flame-graph(bower)- Aggregation algorithm (modified)
Pros
- Easy and simple to generate flame graphs
- Doesn’t need special setup
- Platform independent
- Early performance analysis during development
- Graphical view integrated into every application
Cons
- Imposes 10% overhead during profiling
Summary
To summarize, we have seen three different ways of profiling CPU in Node.js, starting from using OS-level tools to rendering flame graphs on a browser using simple open source JS code. Simple and easy-to-use tools help anyone master profiling and performance tuning. At eBay, we always strive to make some difference in our developers’ lives.