“If you play with fire, you’re gonna get burned.” ~ Anonymous
There were several reasons we built the NodeJS stack at eBay and now offer it as part of our polyglot initiative. These reasons include an active open source community, development productivity, reliability, scalability, and speed. Community support and productivity proved to be true from the start, but when it comes to reliability, scalability, and speed, they all depend on developer culture.
We use static code analysis tools, code reviews, unit tests, and regression testing to make sure our modules and applications work according to the spec. One isolated module can perform perfectly fine in its own test environment and as part of application, but once all the modules are packaged together and ready to roll, the app may turn out to be much slower than one expected, for example, due to logging too much data. This can become a tough time for the application stack provider who does not have answers.
Thankfully, flame graphs came on the scene. They were really promising, but their promise turned out to be far from the reality. The flame graphs turned out to be hot like real flames. We touched them a few times, got burned, and backed off. The first time we approached them, flame graphs were available only in SmartOS, and one had to follow specific steps to generate them, and that was the problem, especially when one runs applications on a completely different platform. Addicted to the simplicity of Node, which just works, we found this option was far from simple, and we put it in reserve for tough cases that we could not solve some other way. The second time that we approached flame graphs, they were already available on Linux or OSX, but creating them still required a special setup and too many steps (including merging symbols with profile results) to get SVG charts in OSX.
“It’s a living thing, Brian. It breathes, it eats, and it hates. The only way to beat it is to think like it.” ~ Robert De Niro (as Donald ‘Shadow’ Rimgale), Backdraft, 1991
Meanwhile, we were using v8-profiler to generate profile data that we would load into the Chrome Profile tool, and then we would analyze the aggregation tree for any performance hot spots. It is a laborious task when one has to look at all the call stacks of a big application, and it demanded a lot of focus. We could not offer this solution to our application developers, as it would take too much of their time to troubleshoot. It was going to become a task for a special profile expert who would do a lot of profiling, get a lot experience, and be able to spot things easily and know where to look. This was not scalable. As a big project started knocking at our door, we had to figure out a better way to profile so that the application developers could do the work by themselves.
We got an idea that if Chrome shows profile results in aggregated format, then there should be a way to calculate the same results by ourselves and present them as flame graphs by using one of the tools available. And we found our calculator and a suitable tool that was built to use JSON as profile data. All we needed to do is to put it all together.
“Playing with fire is bad for those who burn themselves. For the rest of us, it is a very great pleasure.” ~ Jerry Smith, National Football League tight end, Washington Redskins ‘65-77
The result is pretty exciting. We are now able to turn on profiling in production any time without restarting the server and look right into the problem via flame graphs with one click of a button. The results show the JavaScript part of the profiling (no native code), which is what developers want most of the time anyway when it comes to performance issues in their applications.
It also works anywhere that can run Node. For example, developers now can profile right on their Macs or Windows machines without any special effort on their part.
We have already successfully used it to find and optimize performance in platform code as well as in many applications that are soon to be rolled to production. We were able to quickly identify performance problems in production for one critical application when, after a fresh deployment, it started using 80% of CPU instead of the expected 20–30%. Below you can see the problem, it was loading templates over and over again with every request. The fix was simply to cache the templates at the first load.
This first flame graph shows the application’s behavior before the fix. Total time spent on requests was 3500 msec.
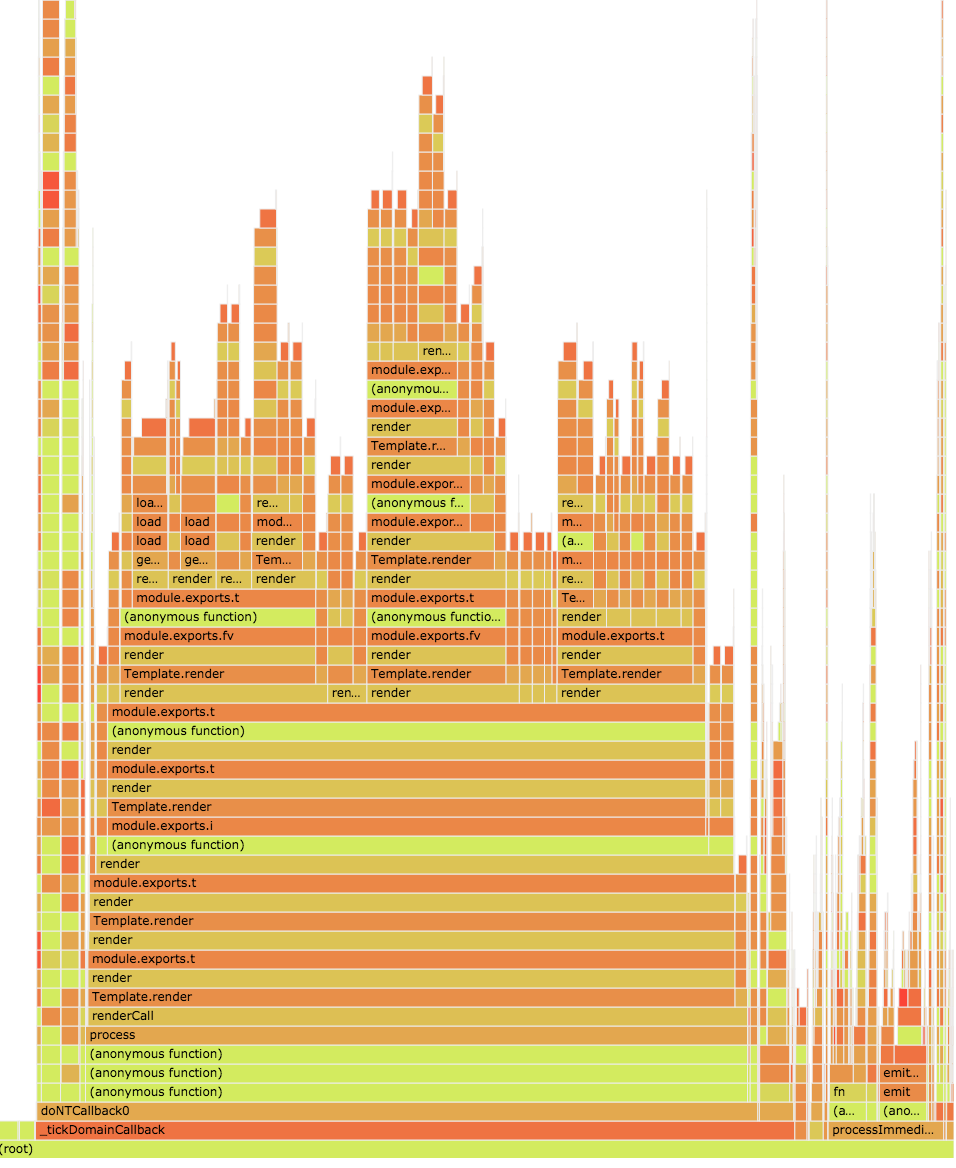
This next illustration shows a close-up view of the same flame graph, highlighting the trouble spots.

This next flame graph shows the optimization we got after applying the fix.
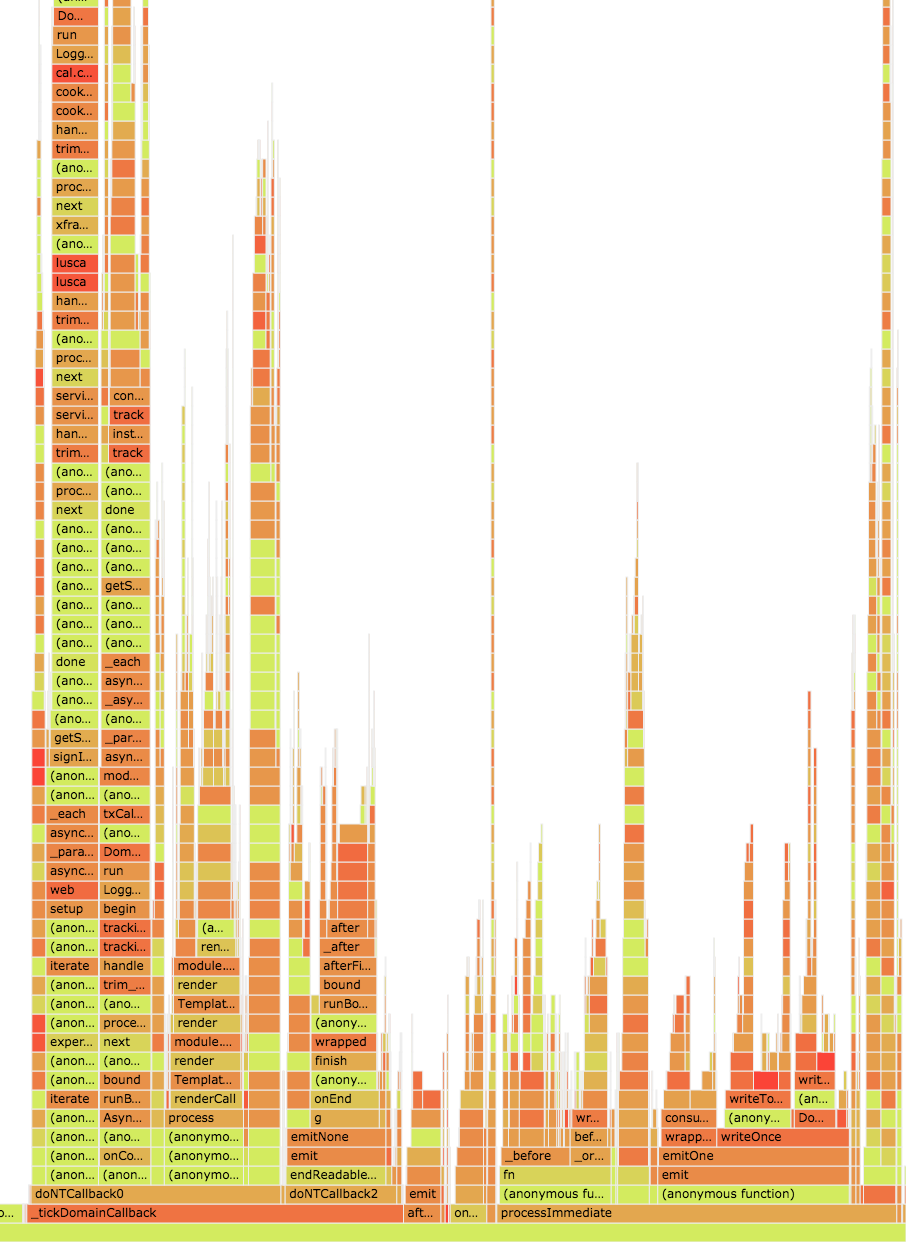
As you can see the rendering part became much smaller. The total time spent on all requests became 1100 msec.
Most of the problems we discovered were not as big as the one that Netflix uncovered with flame graphs, but fixing them helped us save a lot on CPU usage.
“Don’t let your dreams go up in smoke — practice fire safety.” ~ Unknown Author

There is still work to do. We need to train developers to read flame graphs. Otherwise this valuable tool can draw an undeserved negative perception and disappear from the developers’ toolset.
After profiling many applications, we have also found common problems that we can highlight by default, and we can implement new rules for static code analysis to identify these problems.
We have found it useful to profile the following areas with flame graphs:
- Application profiling during development
- Unexpected activity detection during memory leak analysis
- Capacity estimation based on CPU usage
- Issue troubleshooting at runtime in production
- Proactive smoke testing with live traffic in a special environment using a traffic mirror (cloning read requests and directing them to the target test box)
- Sampling and storing for future investigation
To summarize our experience with Node and profiling, I would say that the successful employment of any language, no matter how promising, depends on the way it is used, and performance tools like flame graphs play a major role in helping the developer to accomplish what was claimed at the start.